atomic orbitals
Atomic orbitals
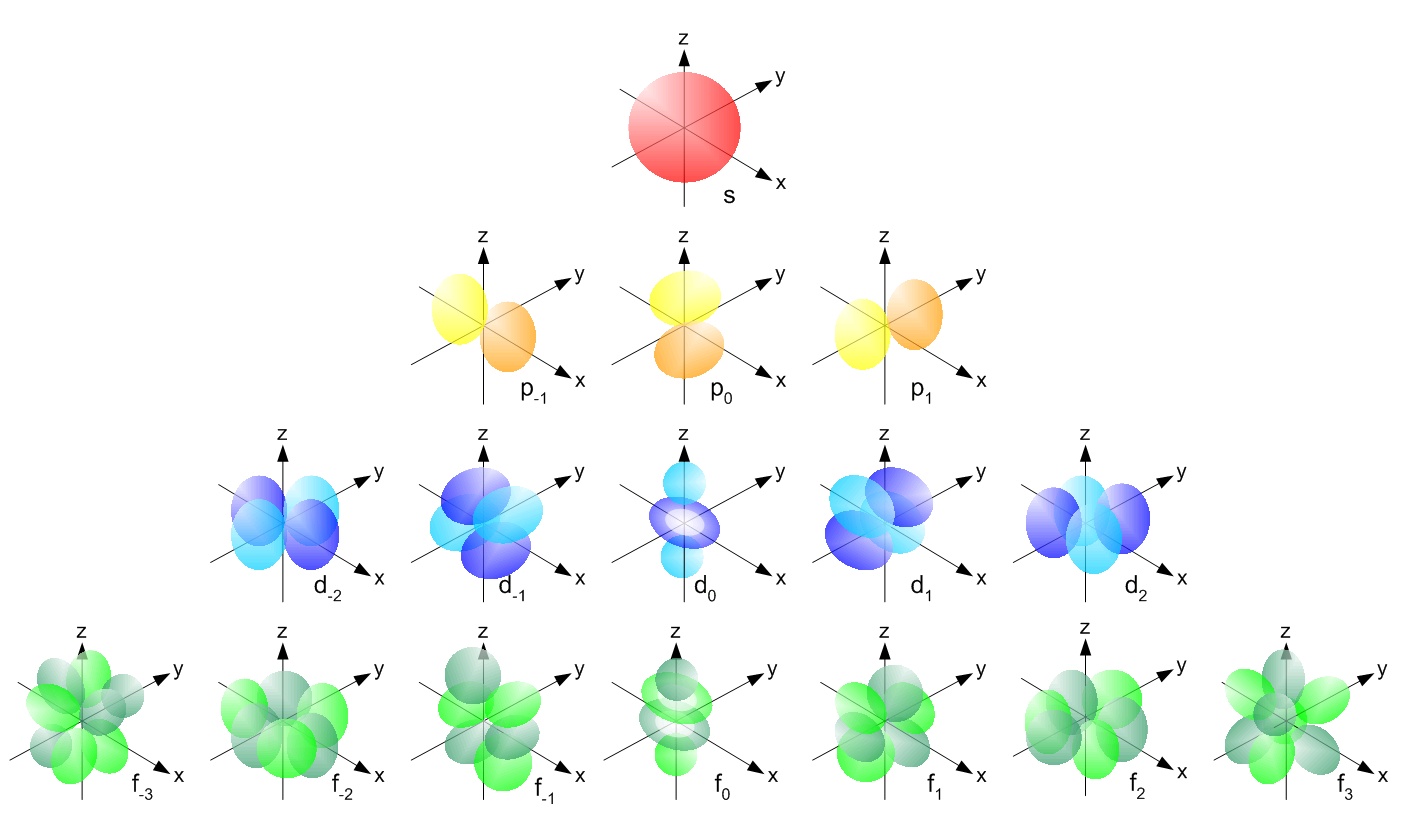
An atomic orbital is a function describing the location and wave-like behavior of an electron in an atom and drawn as three-dimensional surfaces that enclose 90% (as electrons can theoretically be at an infinite distance away from the nucleus) of the electron density. This function describes the electron's charge distribution around the atom's nucleus, and can be used to calculate the probability of finding an electron in a specific region around the nucleus. Each orbital in an atom is characterized by a set of values of the three quantum numbers: Principle quantum number, Azimuthal quantum number, and Magnetic quantum number. An orbital can be occupied by a maximum of two electrons, each with its own Spin Magnetic quantum number (\[\big\uparrow\] or \[\big\downarrow\] spin).
Electrons in an orbital do not orbit a nucleus in the manner of a planet orbiting a star, but instead exist as standing (stationary) waves. Thus the lowest possible energy an electron can take is similar to the fundamental (lowest) frequency of a wave on a string. Higher energy states are similar to harmonics of that fundamental frequency. The electrons are never in a single point location in an orbital, though the probability of interacting with the electron at a single point in the orbital can be found from the electron's wave function. However, electrons also exhibit the number of electrons in an orbital can only be an integer and they jump between orbitals like particles when excited/releasing energy (in the form of electromagnetic waves).
Note: The atomic orbital models such as these (below) only exists for one-electron systems, for multi-electron systems, these are just approximations of the orbital.
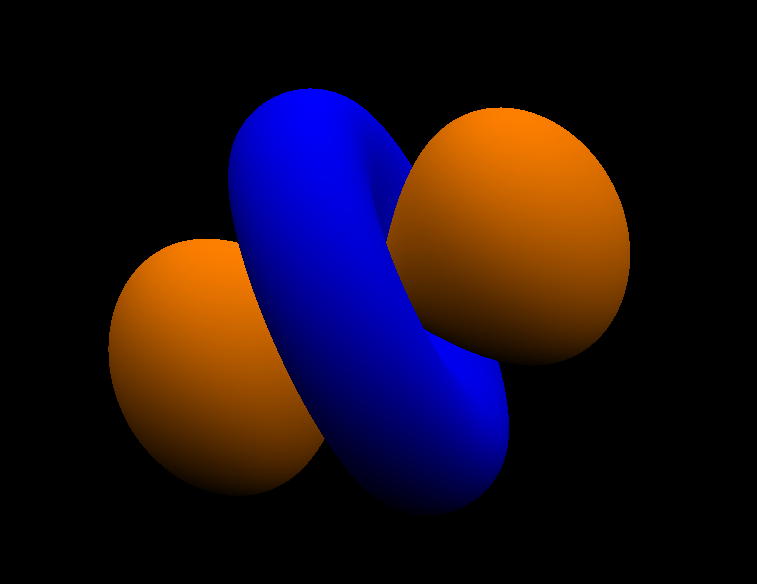
The orange color corresponds to regions of space where the phase of the wavefunction is positive, and the blue color corresponds to regions of space where the phase of the wave function is negative. Electrons (both down and up spin) can be found in both the orange and blue regions. The orange and blue regions have no distinct difference regarding the probability density of electrons. However, it becomes important as the orbitals can be thought of waves, and positive + positive phase wavefunctions overlap to form constructive intereference (increased probability density between the nuclei, forming a bonding molecular orbital) while positive + negative phase wavefunctions overlap to form destructive intereference (decreased probability density between nuclei, forming antibonding molecular orbital). Empty spaces between are called nodes, which is defined as regions with zero electron probability.
Do orbitals overlap?
If you mean to ask if these regions overlap, yes, they certainly do. If you mean to ask if the regions of space where the probabilities are nonzero overlap, they even more certainly do, as the probability is non-zero almost everywhere (i.e. zero on set of volume 0). If you mean to ask if they (or rather the spaces they span) in the state space overlap, then no. This is because an electron in an orbital does not have a definite position. Moreover, two electrons cannot be in the same state (due to Pauli's Exclusion principle) so, no, you could not measure two electrons to be in the same place for that would mean that two electrons have the same state.
What exactly are orbitals then?
Radial probability (the probability of finding a 1s electron at a distance \[r\] from the nucleus) is found by adding together the probabilities of an electron being at all points on a series of \[x\] spherical shells of radius \[r_{1}\], \[r_{2}\], \[r_{3}\], … , \[r_{x-1}\], \[r_{x}\]. In effect, we are dividing the atom into very thin concentric shells, much like the layers of an onion, and calculating the probability of finding an electron on each spherical shell.
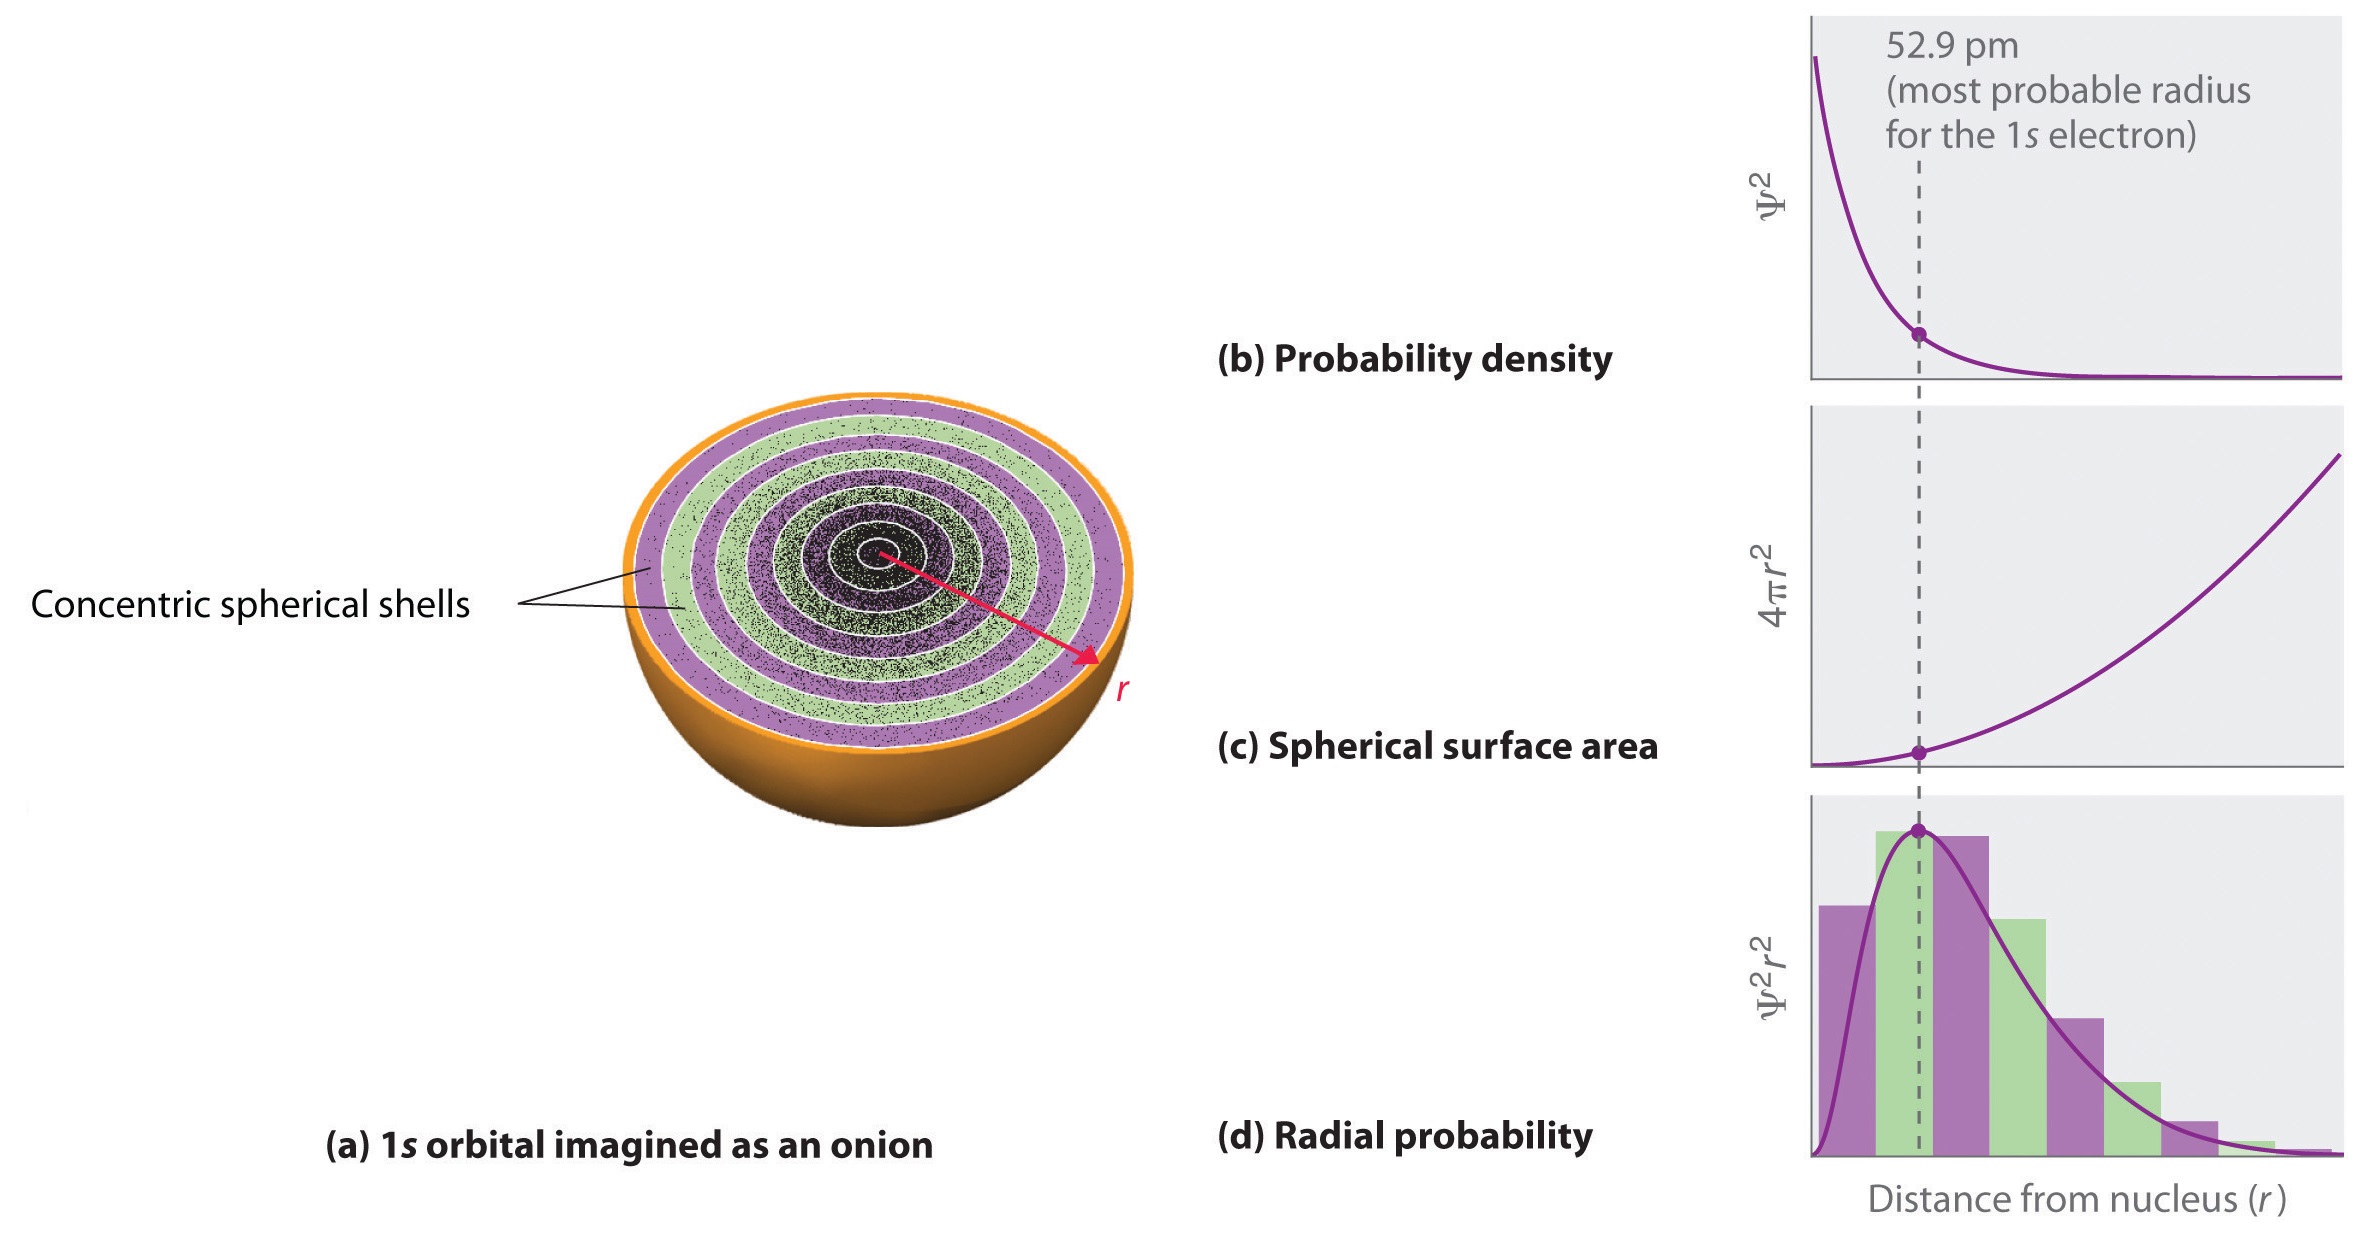
(a) Imagine dividing the atom's total volume into very thin concentric shells as shown in the onion drawing. (b) A plot of electron probability density \[\psi^{2}\] versus \[r\] shows that the electron probability density is greatest at \[r=0\] and falls off smoothly with increasing \[r\]. The density of the dots is therefore greatest in the innermost shells of the onion. (c) The surface area of each shell, given by \[4\pi r^{2}\], increases rapidly with increasing \[r\]. (d) If we count the number of dots in each spherical shell, we obtain the total probability of finding the electron at a given value of \[r\]. Because the surface area of each shell increases more rapidly with increasing \[r\] than the electron probability density decreases, a plot of electron probability versus \[r\] (the radial probability) shows a peak. This peak corresponds to the most probable radius for the electron, 52.9 pm, which is exactly the radius predicted by Bohr's model of the hydrogen atom.
s orbitals
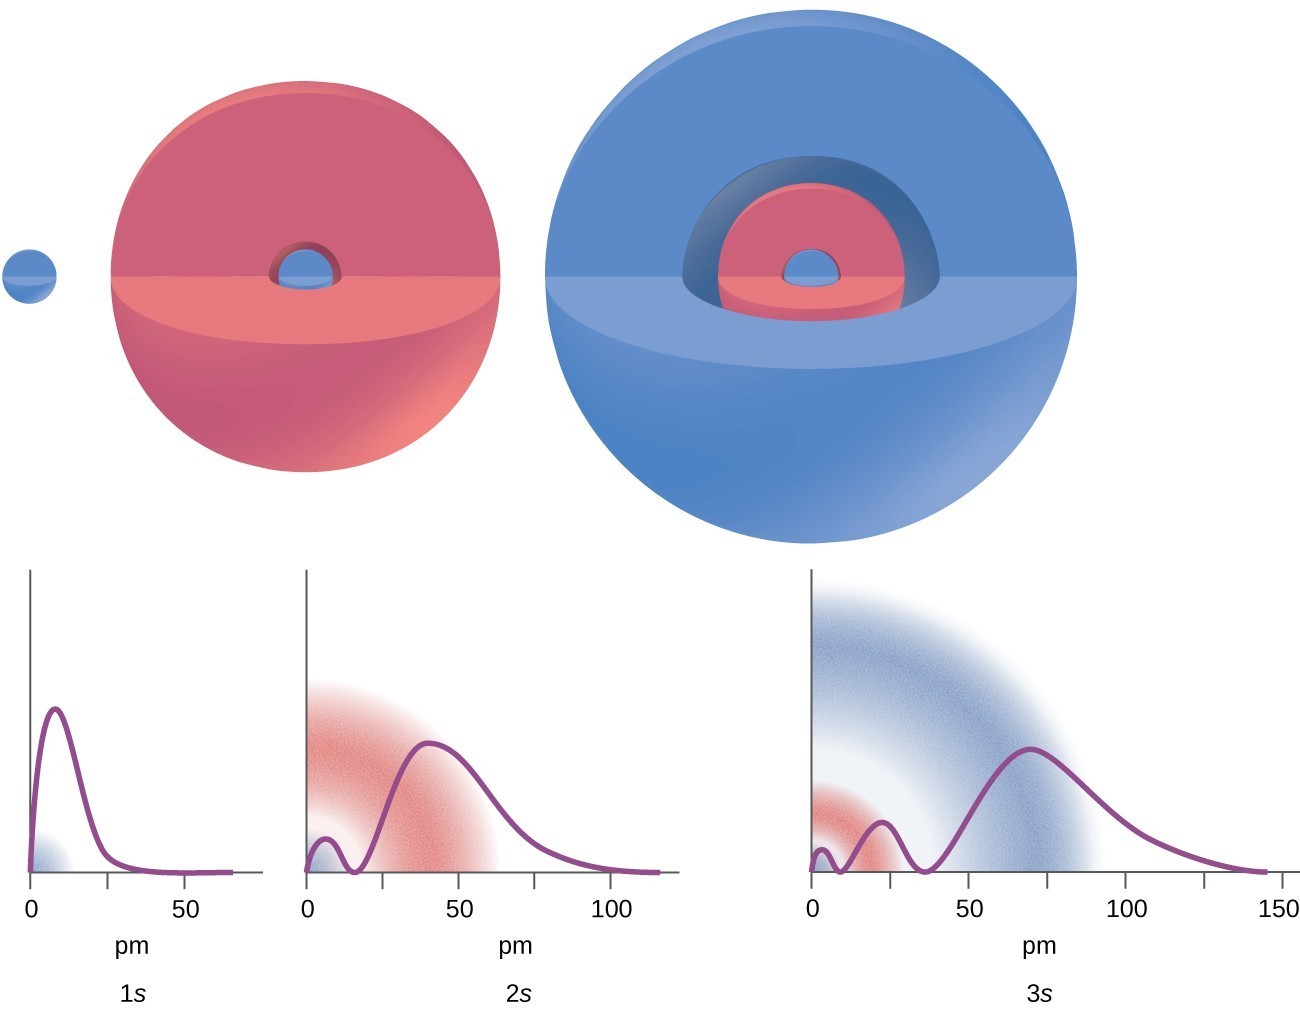
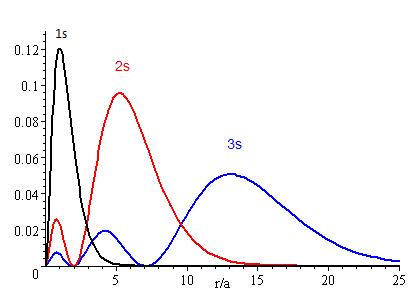
The graphs show the probability (y axis) of finding an electron for the 1s, 2s, 3s orbitals as a function of distance from the nucleus.
p orbitals
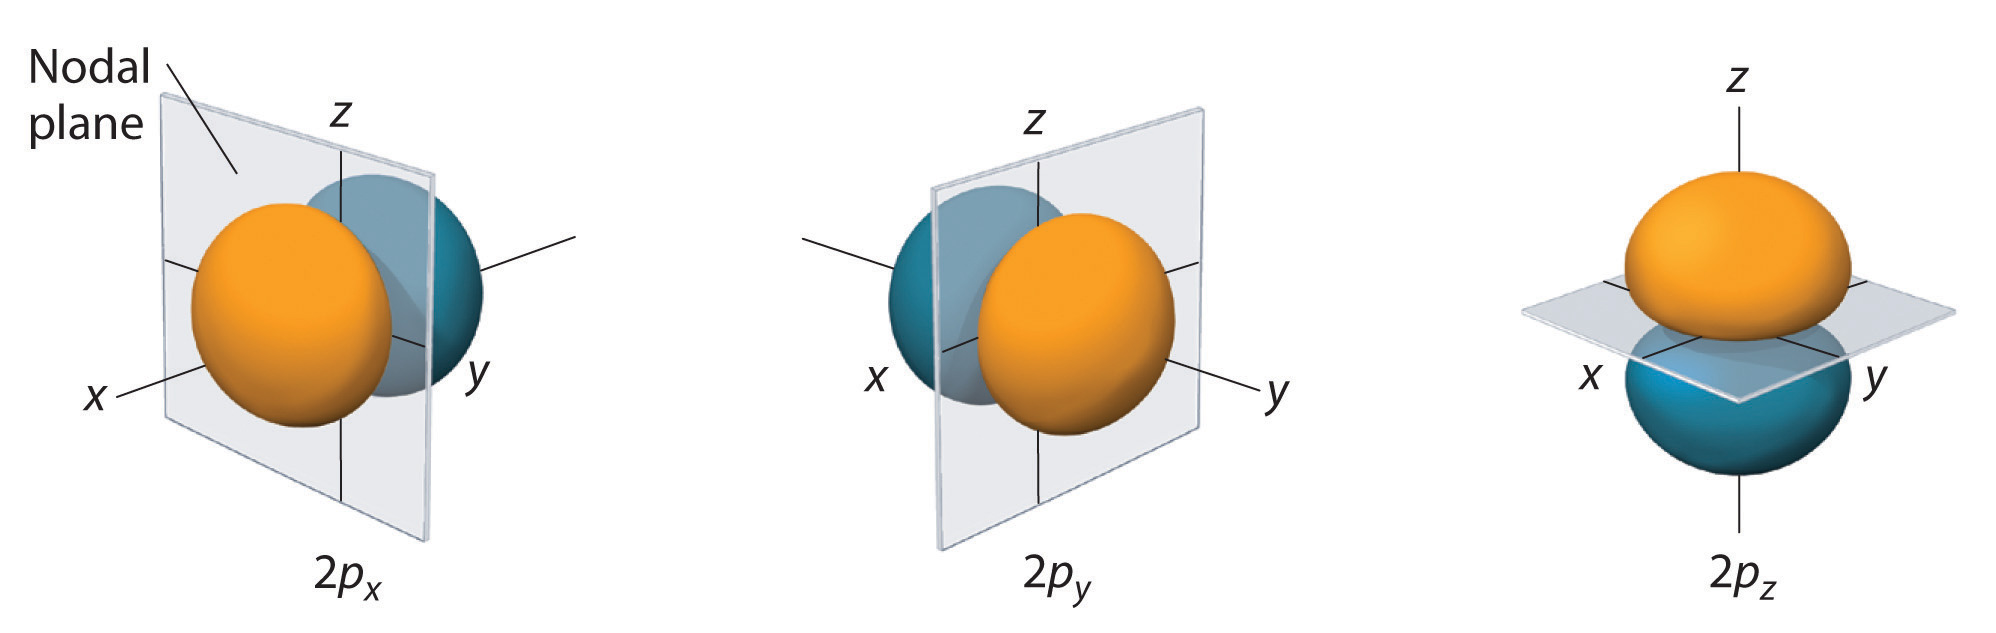
The surfaces shown enclose 90% of the total electron probability for the 2px, 2py, and 2pz orbitals. (The different orientations are determined by the Magnetic quantum number).
d orbitals
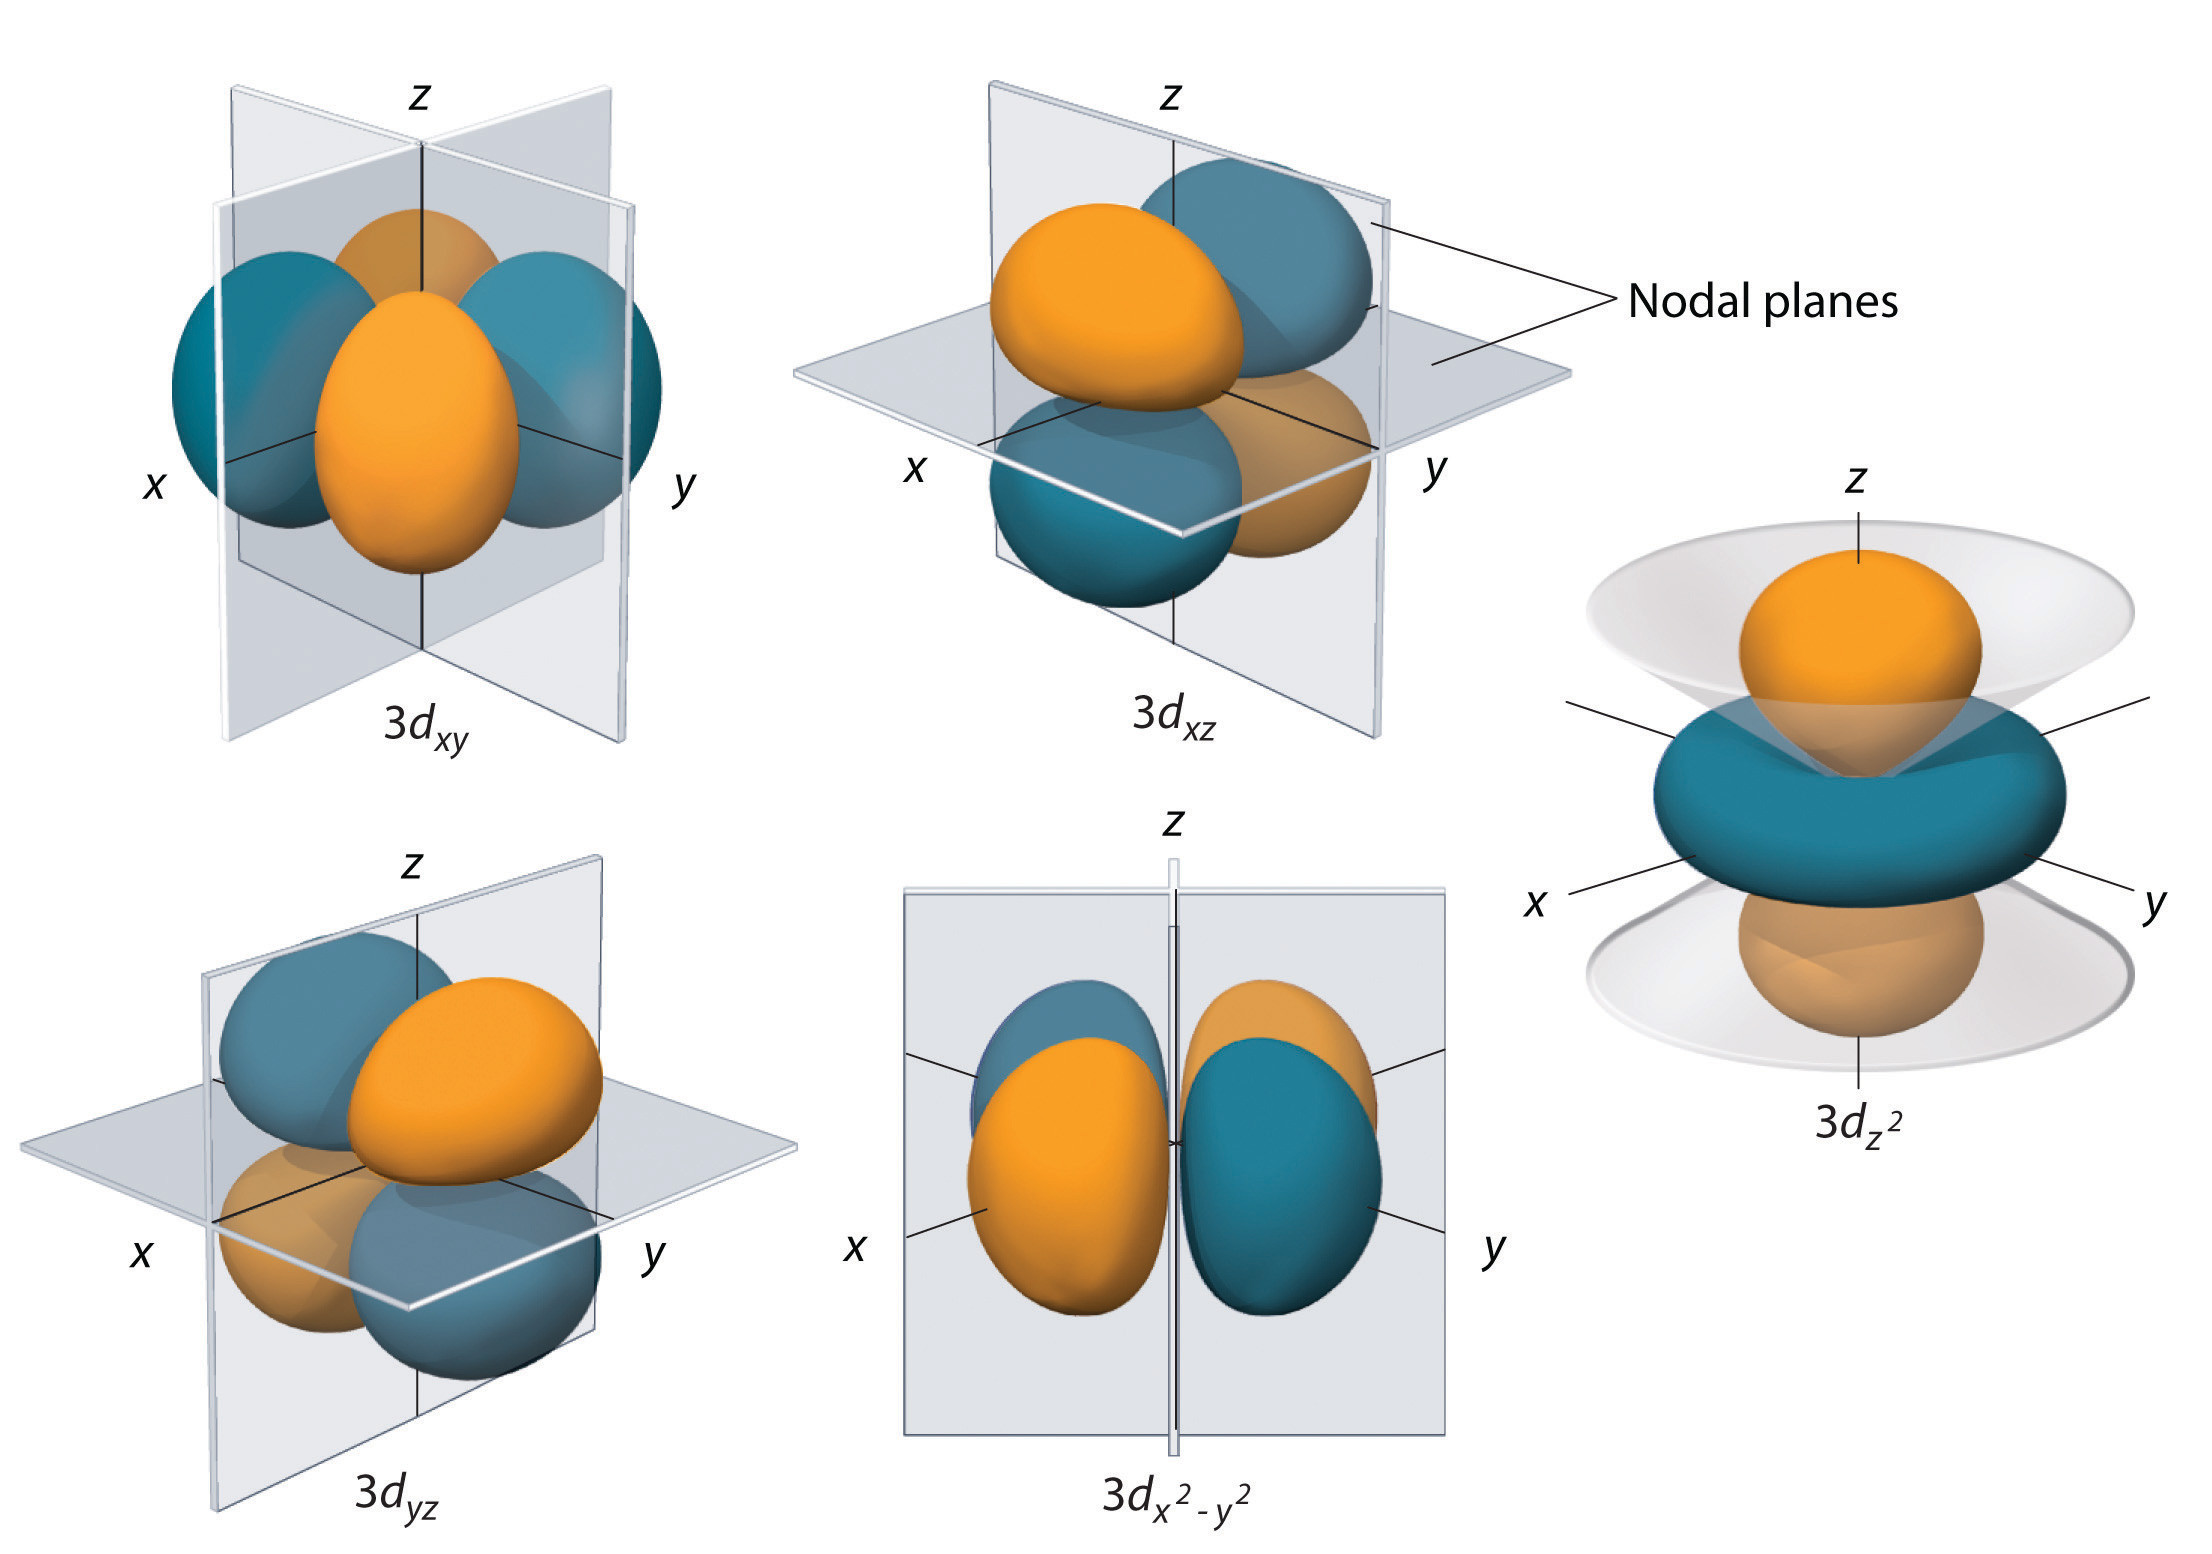
Full diagram of orbital shapes